Visualize rules and results#
Ex-Fuzzy can also visualize the fuzzy sets and the rules obtained after the training process.
The easiest way to do this is using the eval_tools.eval_fuzzy_model function:
import eval_tools
eval_tools.eval_fuzzy_model(fl_classifier, X_train, y_train, X_test, y_test,
                        plot_rules=True, print_rules=True, plot_partitions=True)
This function prints the performance of the model, prints the rules on screen and plot the rules as graphs.
Visualize Rules#
You can visualize each consequent rules as a network, so that the interactions between the antecedents can be seen.
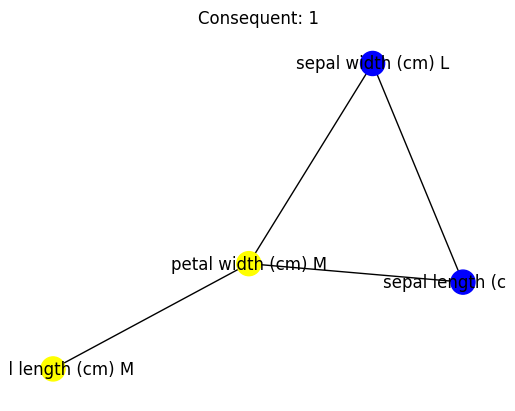
If the number of linguistic variables is three, they also get automatically colored. It is also possible to export them to the gephi software.
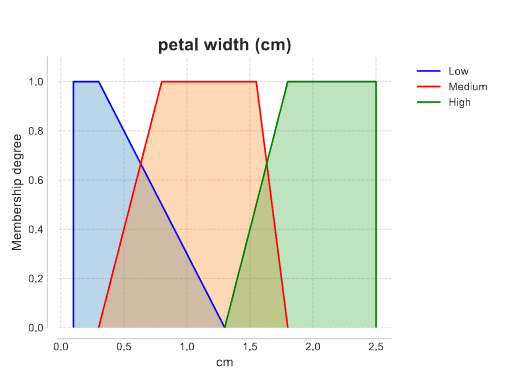
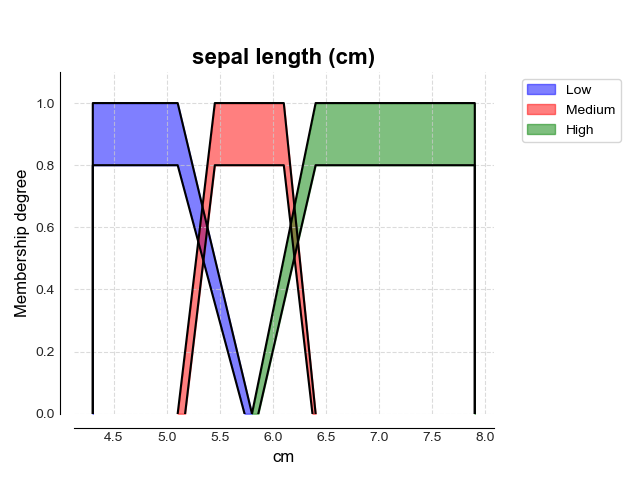
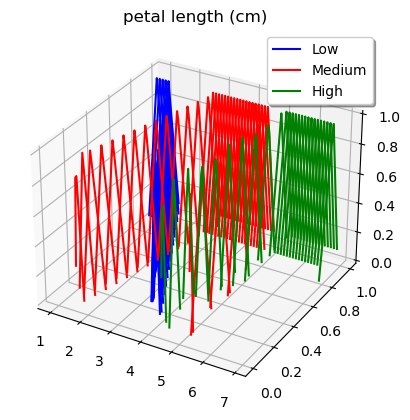
Visualize Fuzzy Sets#
Each fuzzy set is also visualized according to its own kind. The same linguistic variable can be visualized using T1, IV and GT2 fuzzy sets: